U.S. Power Plant Predictions
This is a short introduction and writeup to my plotly dash app concerning predictions for U.S. power plant output. The project code is here.
Newer non-standard python libraries needed (Numpy and pandas needed, but they’re rather standard at this point):
dash				-       pip3 install dash
dash-bootstrap-components	-	pip3 install dash-bootstrap-components
dash-daq			-	pip3 install dash-daq
plotly				-	pip3 install plotly
visdcc				-	pip3 install visdcc
category-encoders		-	pip3 install category-encoders
sklearn				-	pip3 install scikit-learn
gunicorn			- 	pip3 install gunicorn
lxml				-	pip3 install lxml
definitely a lot of requirements, but some of those are required for the prediction (lxml allows pandas to read excel, category encoders and sklearn for making the predictions, etc.)
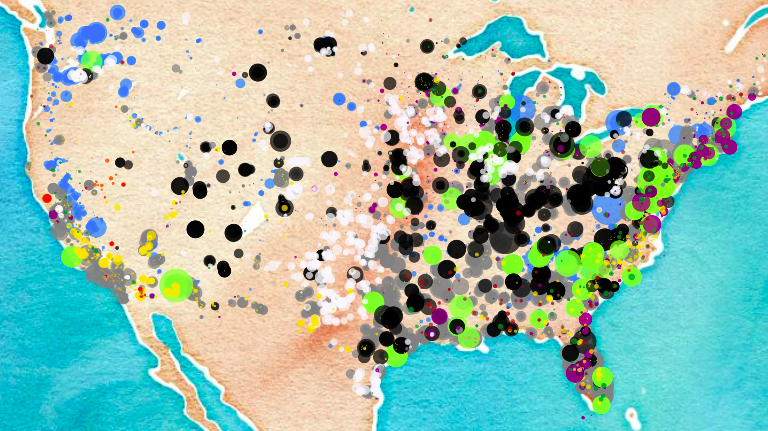
The final product
Please click the image to explore the dash app
Inspiration
This project is a stepping stone towards a project that interests me much more. Ultimately, I’d like to present a map (interactive if possible) of ideal locations for renewable energy technologies – solar panels in the sunniest spots, wind turbines in the windiest locations, wave power where applicable, nuclear (not renewable per se but carbon clean for sure) to fill in the rest).
In the meantime, this project provides a decent introduction into my use of interactive maps using plotly and dash served on Heroku servers.
Code Overview
What can I say? There’s a lot to this.
Generally with dash apps, we set a layout. I have a two column layout and my columns were defined outside. A simplified version appears as:
column1 = dbc.Col([

    dcc.Markdown(
            """
            ## Predictions
            """
            ),


    html.Label('Select plant type'),


    dcc.Dropdown(
        id = 'plant-type-dropdown',
        options = [{'label':plant_type,'value':plant_type} for plant_type in plant_type_list],
        placeholder = 'Select plant Type...'
        ),

    ],md=4
)


column2 = dbc.Col(
    [
        dcc.Graph(id='graph',figure=fig),
        visdcc.Run_js(id = 'javascript'),

    ],md=8
)


layout = dbc.Row([column1, column2])
My column 1 is much bigger than shown, with the many dropdowns, sliders and numeric inputs available, it would be repetitive for this demonstration.
Notice the very “CSS” or “C++” style with separating the opening and closing brackets on different lines. It hints at the development by more web and low-level programming developers.
The last major feature in the code is the ability to create “callbacks” which allow the output of one function to serve as the input of another then allowing a live update on the rendered page after the change is made.
@app.callback(
        Output('energy-source-dropdown','options'),
        [Input('plant-type-dropdown','value')])
def update_energy_source_dropdown(option):
    return [{'label': source,'value':source} for source in plant_type__energy_dict[option]]
it follows a fairly straightforward syntax. You specify the id and value in the Output (only one is allowed) and the same with the input (multiple are allowed). In the example above, the value in my plant-type-dropdown serves to generate the options for the next dropdown menu energy-source-dropdown. The definition below establishes that relationship which in this instance is just a dictionary (specified elsewhere in the code). In another related instance, the definition returns values from a pandas groupby method call. The possibilities are only limited by your imagination
This is very powerful stuff. It brings to the hands of one person the ability to code effectively from scratch what would normally require additional assistance from full stack web developers.
Insights Gained
All this said, I wasn’t able to get by with pure python. Plotly, the underlying plotting utility I used in conjunction with dash lacks some functionality I wish. It can plot points on a map, but unfortunately, can’t return the latitude and longitude by free choice on a click. To get around this I had to use the visdcc library to allow the use of JavaScript. This took significant assistance from google and my friend Richmond. The solution, while hacky, is still quite beautiful.
@app.callback(
    Output('javascript', 'run'),
    [Input('graph', 'id')])
def getlnglat(x):
    if x:
        return(
        '''
            let map1 = document.getElementById('graph')
            let map = map1._fullLayout.mapbox._subplot.map
            map.on('click', function(e) {
            let lngLat = e.lngLat
            setProps({'event': {lon: lngLat.lng.toFixed(3), lat: lngLat.lat.toFixed(3)}})
            })

        ''')
    return ""
I also used a virtual environment because I’ve been reading about this whole “works on my machine” phenomenon, so I experimented with isolating the environment. My repo contains the associated Pipfile.
Biggest takeaway:
Get better at JavaScript
I’m fairly sure I will look back on this code as I do at some of my first python code, with the thought “god what a novice” (I remember having some code that was like 20 lines long, I didn’t know about the range() function, which would have brought it down to maybe 3)