Mountain Project Webscraping
 Non-standard libraries needed:
BeautifulSoup	-	pip3 install python3-bs4
pandas		-	sudo apt-get install python-pandas
You can see the notebook and data here on GitHub
Inspiration
Mountain Project has been on my mind recently because I’ve had an idea brewing in my head ever since my Crossfit webscraping project which I made during a 2 week-long break in the middle of my 3 month climbing trip (precisely 1 week before my laptop was stolen). While on the trip I often found myself in areas without internet connection and I got annoyed typing the coordinates of the walls in my Garmin e-trex. (For those not familiar, the Mountain Project app has a “Directions” button so you can navigate to each wall area. It will open it up on your phone’s GPS. The coordinates are saved on the app however, so when I press it, it tries to navigate to the coordinates. I can still see the coordinates though and manually plug them into my actual GPS).
This unfortunately is not the project, but while working on it, I explored the website and had another idea. Could I scrape user data much like the Crossfit scraper? The answer is yes. With it I did a short analysis of trad climbers vs. sport climbers vs. boulderers which you can read about here. The more interesting part was how the data was scraped and that’s the purpose of this post.
Code Overview
This relies on beautiful soup but only briefly. The actual Mountain Project work doesn’t require it, but I needed to source my search for users with names, so I grabbed the top 600 male and female baby names from 1985 from this site (this is because I assumed a good chunk of climbers who’ve been posting for a while are in or quickly approaching their 30’s … it doesn’t really matter though; people’s names shouldn’t affect their climbing ability)
I looked at the console when searching for a name and observed the query when I chose “show more users”. Copying and pasting this into the browser returns a JSON string with the first 50 users by that name and with that, their user ids. I can formulate the users’ profile page urls and download their route csv summary. Shoutout to my team lead Richmond for pointing out this trick with the console.
I did this entire project in an ipython notebook because it’s easier to see and manipulate the pandas dataframes in real time.
Code Details
Gathering the baby names was very standard. I’m realizing right now I could have used pandas because the names were in a table. I even use pandas ability to read HTML later in this code when I’m converting route grades. It serves as a good illustration that are multiple ways to achieve the same results… Anyway the baby names were in a table so I parsed the soup for all standard table cells <td> with class=n (obtained via inspection of the webpage. Once that’s done and I have a list of potential users, for each name in the list, I make a query to obtain their user ids (the main thing I need to gather data from their profile pages). Here’s how to find out what the query should look like:
-
Open up the console on the website you’re inspecting (ctrl+shift+J)
-
Click the
networkingtab -
Type in the name you want to search, Melvin for example
-
Observe the responses that show up. Hunt for something that looks relevant. (The following showed up after I clicked “See all x users”)
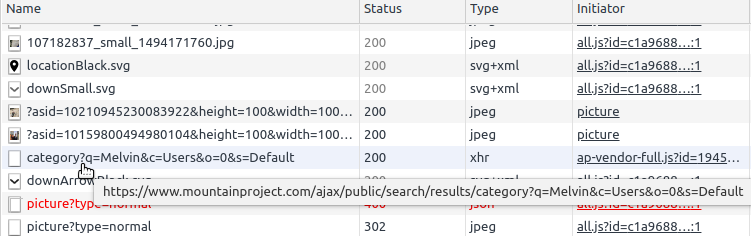
- Open that URL and inspect
Downloading user data
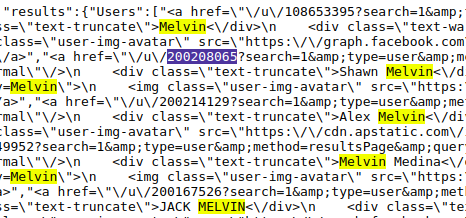
As you can see, there are many Melvins here and for each there is a 9 digit user id. When I was playing around with a user page, I noticed you only need to put in their 9-digit user id and it will redirect to their full profile page
(eg.mountainproject.com/user/######### becomes mountainproject.com/user/#########/Mr-Melvin)
We can use the requests library to return the user name, input it into the url and with this we can get the full id then add a “/tick-export” to download the csv of their “ticks” (the data for the routes they’ve climbed)
More explicitly:
def get_csv_url(id):
  user = requests.head(f'https://www.mountainproject.com/user/{id}').headers['Location'].split('/')[-1]
  return f'https://www.mountainproject.com/user/{id}/{user}/tick-export'
Creating features
At this point, it’s all about feature engineering. After throwing away the non-viable (empty) tick-lists, I then created the following features:
-
Average and Max route and boulder grades
-
How many free solos (climbing without a rope) the climber has done and the hardest solo.
-
Number of sport climbs and trad climbs
-
Total climbs
-
Number of distinct locations
- Danger factor: in climbing there can be
- normal - Just a standard climb, no danger: 0
- PG - If you fall, you could get hurt: 1
- R - A fall may be seriously hurt you, or protection opportunities are sparse: 2
- X - A fall may result in death: 3
=>The danger factor is the mean of this column
- Success: The number of onsights (climbing the route first time with no falls or hangs)
I had to change the grades from strings like “5.10d” to a numerical factor (10.9 in this case). I did this by grabbing this chart with pandas, converting the relevant columns into a list and zipping that into a conversion dictionary with a Numpy array.
There are many other features I can create, but It will take time to run. Admittedly, the hardest thing about this is dealing with inconsistencies in users logging their ticks. Some check “solo” for boulders, some don’t choose whether a route is TR, lead, etc. and many people just are lazy and don’t log most climbs. So some of my analysis factors that in and removes for example people who have logged fewer than 30 climbs (an arbitrary choice to be sure)