RideShare Clustering
The following is the explanation of a program I co-wrote with Austin Taylor. The completed project and write-up can be found here.
Non-standard library needed (just the one this time):
adjustText - sudo apt install adjustText
Inspiration
In my Junior year at UCSB, I joined Music Connection, a club that would get together on weekends to play music to local retirement centers and homeless shelters. The number of members was large enough and their school schedules varied such that each week, a different subset of people from the group would go, so it wasn’t the same group each time. To facilitate the rideshare process, we would assign one person to contact everyone on that week’s signup list to ensure everyone would have a ride. It can be quite the undertaking for that person to contact everyone on the gig list, find out their addresses, check who’s driving, and establish a pickup point. What follows is a means of automating that process.
Overview
In general, each week, the members would fill out a simple google form with the following questions?”
-Are you going to the gig?
-Driver or rider?
The club members would have to complete the survey through their gmail accounts and so by the end of the week we would get a downloadable csv file with the following information:
| going?(y/n) | Driving?(y/n) |
In preparation, someone would need to make a file of potential pickup locations (the more the better) which would just be a csv file with the name of the place and the GPS coordinates. The members would have also needed to fill out another one-time survey specifying: their names, email addresses and GPS coordinates of where they live — the Master List (admittedly people are reluctant to do that), and with the weekly email completed, the email, the program would check those who put ‘Yes’ down as going to the gig, then the code would crosscheck that against the masterlist to pull their names and locations. This is a great segue to the actual details.
Code Details
Step 1 — creating the dictionaries
The members who indicated they were going are turned into dictionaries. The dictionary keys are “name”, “x”, “y”, “email”, where “x” and “y” represent the longitude and latitude. These are split into separate lists of dictionaries based on whether or not they indicated they would be able to drive. Similarly, all potential pickup locations would be made into dictionaries, but without emails (that would be silly).
Lessons learned
So, having a list of unnamed dictionaries wasn’t going to be useful unless we could actually ascribe that dictionary to a rider’s name. In other words, can you think of a way to turn the dictionary {'name':'john','x':2,'y':7,'email':'john@gmail.com'} and create a variable representing that dictionary (e.x. john = ...')
Here’s how you would do it in python:
for rider in riders:
	name = rider['name']
	vars()[name] = rider
vars is an interesting function. If you just call print(vars()) you’ll get a dictionary object whose keys are generally what you’d find as objects of a class. If you import any module and then act on it with vars(), you get all this information filled in for that module. What we are doing above is really just abusing this extra seldom used dictionary and adding keys (our rider names) to it. We couldn’t have used a new blank dictionary though because the element wouldn’t be callable. When it’s in vars() it’s callable at any point, so that’s pretty useful!
Step 2 — Clustering the riders
In general, we create clusters by just grouping the nearest points and then once the cluster is a cluster of 3 points, that group is removed (the assumption is that the car will have one driver and 3 occupants. This assumption is not made in and can be adjusted in the demo version).
Now, there are many ways to cluster points, but we went with a kind of agglomerative clustering which is intuitively based on grouping by shortest distance, then once the group size reaches 3, it’s pulled out of the pool of unclustered points and this goes on until there are no more left. The question is: what in this case determines the distance between a point and a cluster.
We could have found the epicenter of the group and used that, but it’s computationally expensive as the number of points grow.
One suggestion is just to use the distance between the point and the nearest point of the cluster. This is known as “Single-linkage clustering” and tends to lead to long, stringy clusters. We went however with “Complete-linkage clustering” which determines a point’s distance from a group as the distance between the point and the furthest point of the group. This leads to more globular-shaped clusters.
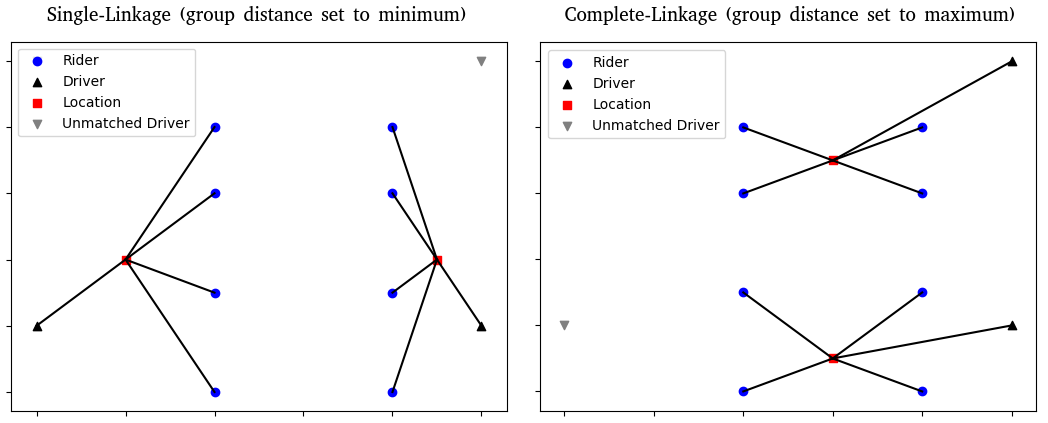 There is one line of the code where you can change ‘maximum’ to ‘minimum’ to change from using complete-linkage clustering to using single-linkage clustering… can you see where? Think about what’s being maximized or minimized
Lessons learned
Initially the clustering was very simple. We take our N points and turn that into an nxn adjacency matrix i.e. a matrix where the i,j entry represents the distance between points i and j. The cluster would just be the smallest element of the matrix. Naturally this is symmetric and the diagonal is filled with 0’s which would of course always be the smallest distance, but we convert the diagonal into NaN (Not a number) to preclude the trivial case from getting us nowhere in our clustering.
As I said, initially this was simple, but it would lead to the undesirable effect of giving a group of 4 instead of 3. You see, the program would see two groups of 2. Since they are <= 3, they are not fully clustered and remain in the adjacency matrix for the next step. And if they are the closest, they will be grouped as a group of 4. So, with a max size of r riders, we can expect to see edge cases of up to 2(r-1) sized groups.
The primary way we (and by we, I mean my very gifted project partner Austin) figured a way around this was to used masked arrays, a Numpy module which will hide the array entries from the unmasked portion. Very simply, if the sum of the elements in the groups being clustered exceeded the preset cluster size, a boolean would be attached to the groups hiding them from each other.
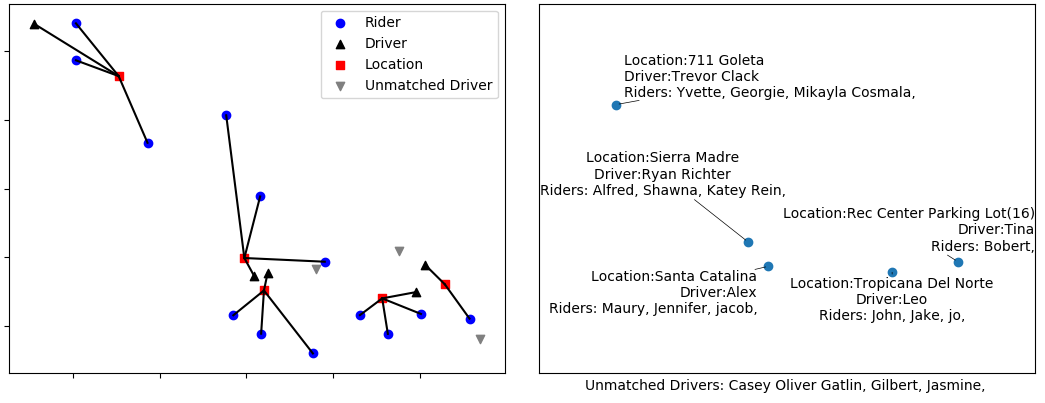
After the riders were clustered, their group epicenter is calculated and they are assigned to the nearest pickup location, usually given the coordinates of a coffee shop, bus stop, or similarly pre-selected open pickup spot. Nothing precludes multiple groups from being assigned to the same pickup location. Each driver is then assigned to the nearest of the assigned locations.
Demo
With preloaded data already loaded in GitHub (some extra fake names added) Running main.py from a terminal with the files procured from the google surveys (going.csv, Locations.csv, Masterlist.csv) Here’s the graphical output:
A demo version is available for you to play around with. You’ll need the following files in your directory: demo.py, DatGen.py, demosclustfunc.py
First run DatGen.py and follow the input questions. This will create two files: SampleDatMasterList.csv and SampleDatLocations.csv. For simplicity’s sake, this assumes all riders in the master list will be going. You can add as many riders, drivers and pickup locations as you want and change the max group size. It’s quite fun!
Future Improvements - errata
[] Geography nerds may recognize that the earth’s curvature will affect the distances, as the shortest distance between two points directly east and west is not a line of latitude, but a geodesic. However in this case, for clusters within a small city, taking this into account is unnecessarily complex, so I’m assuming Lat. and Long. are Euclidean.
[] For rather large numbers, the plot generation can take some time, time-complexity is rather high with all the “for loops” and I may try and work in more steps to be performed in fewer loops.
[] …so this is embarrassing. If you call DatGen.py and pay close attention to the generated plot, then run demo.py to cluster, you will notice the x and y coordinates are flopped. I could just swap the plot axes, but I’m not actually sure why they’re flopped. I’ve checked out the code several times but couldn’t see where it occurred. So I’m not changing it until I actually understand why it’s happening.